Container Tools flow
Debug a Node.js container with VS Code
Regular Container Tools flow
The regular flow requires the VS Code Container Tools extension, listed as Docker in Extensions. The extracted application directory is opened as the workspace. A workspace is the host directory VS Code treats as the root of the project:
code <APPLICATION_DIRECTORY>The image is built and started from the existing Dockerfile:
Dockerfile -> right click -> Build Image...
-> enter an image tag or keep the default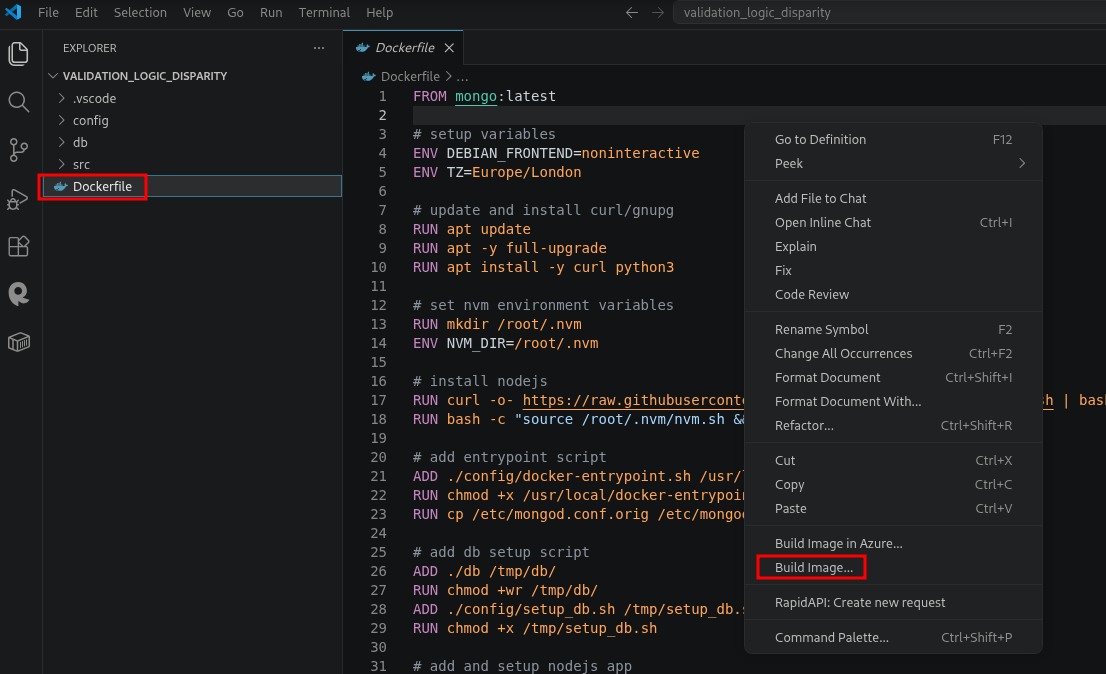
Containers panel -> Images -> <IMAGE> -> <TAG> -> Run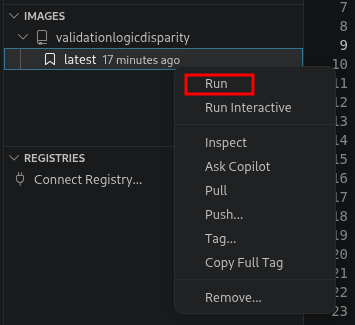
Run Interactive performs the same start while keeping the container logs visible. Once the application is running, the run icon under Run and Debug uses the selected project launch configuration to attach the debugger. A launch configuration is a .vscode/launch.json entry that tells VS Code which debugger to use, whether to launch or attach, and how local source paths correspond to paths in the running process.
Only one container can bind a particular host port at a time. Bind for 0.0.0.0:<PORT> failed: port is already allocated means that an earlier container or another local process already owns that port. The earlier container can be stopped from Containers panel -> Containers -> <CONTAINER> -> right click -> Stop before starting the debug container.
Container files remain accessible from:
Containers panel -> Containers -> <CONTAINER> -> Files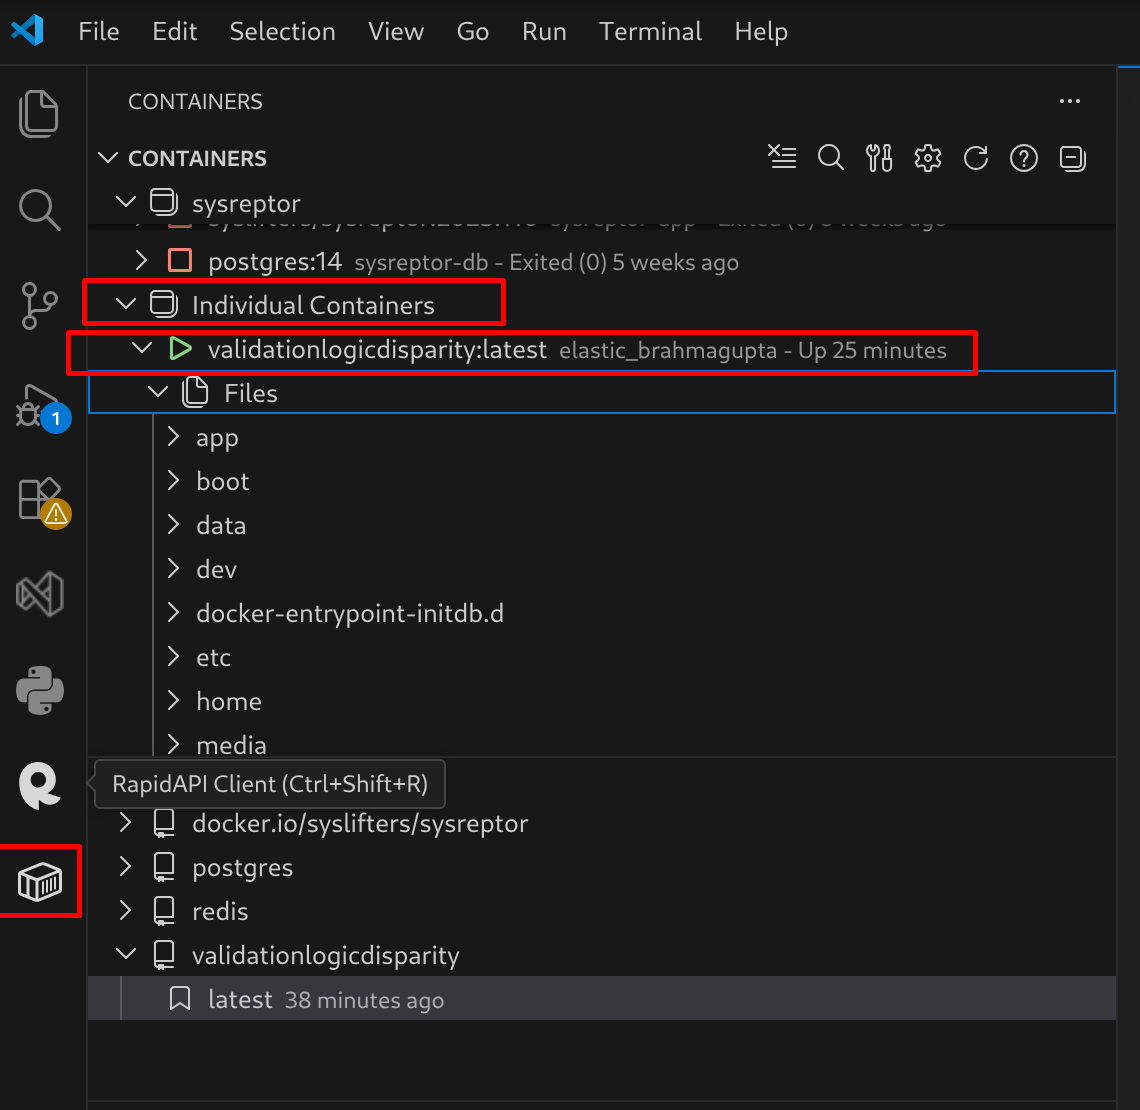
An interactive shell is available from:
Containers panel -> Containers -> <CONTAINER> -> right click -> Attach ShellDockerfile debugger error
VS Code may report that no extension is available for debugging the active Dockerfile and offer to search the Marketplace. The project launch configuration supplies the application debug target.
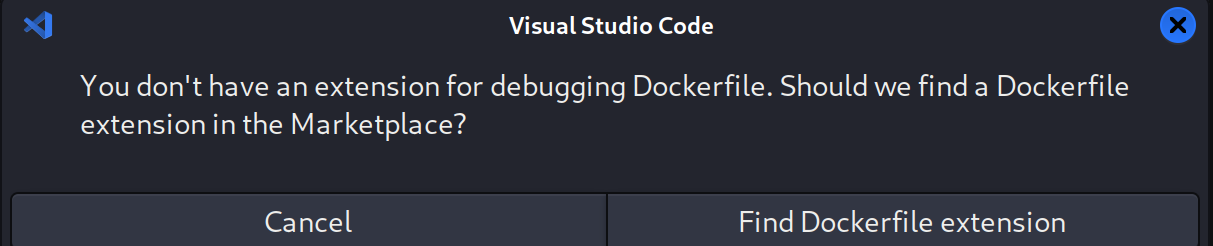
It appears when the active editor contains a Dockerfile and no applicable project launch configuration is selected. Run and Debug then treats that file as the requested debug target. A Dockerfile contains the instructions for building an image. The application process running inside the resulting container is the required attachment target.
The project launch configuration under Run and Debug is the regular attachment method. When no launch configuration is available, Dev Containers provides access to the already-running container:
Dev Containers extension
-> Ctrl+Shift+P
-> Dev Containers: Attach to Running Container...
-> <CONTAINER>
-> File -> Open Folder -> <REMOTE_ROOT>
Dev Containers starts a separate VS Code window whose file operations and terminals run inside the selected container. The bottom-left Container: ... indicator confirms that the new window uses this remote environment. Paths opened in that window are container paths rather than paths on the host.
A Dockerfile COPY instruction stores the source files as an image layer at build time. The running container therefore contains a snapshot rather than a live reference to the host directory. Later host changes require another Build Image... unless a bind mount explicitly maps the host directory over the container path.
Find by: vscode, container tools, docker debug, dockerfile debugger error, run and debug, dev containers, attach running container, remote root, copy snapshot